
Table of Contents
Introduction
If you are a trader in the stock market, the most important thing that you want to understand is the volatility of the market. Why? because it will decide what strategies you will deploy to gain out of the nature of the market prevalent at that time. But what is volatility? In simple terms, it is a measure of how the price of a stock or underlying instrument changes over time.
Even though there are many methodologies to measure volatility, this article focuses on only one volatility index that is most popular and easily available to use in the Indian stock market, India VIX. The main reason I took more than two months to publish this article after my first one is that there is neither a definite guide on the methodology of India VIX calculation nor even a single worked example of how VIX is calculated. So if anyone attempts to calculate the VIX manually, results can not be cross-validated for accuracy. All references I could gather on the web either give only formulas and stop at that or present calculations that are either irrelevant or dated. Many blogs and articles (almost everyone 😉) have chosen the approach of simply emphasizing topics of how to interpret the VIX rather than putting a bit of mathematical rigor in explaining how to apply the formula to arrive at VIX.
Hence this is an attempt to show readers how VIX can be calculated by using public data and reveal the sorcery around it.
What is India VIX?
CBOE Global Markets, Incorporated (CBOE), in 1993, introduced the CBOE Volatility Index (VIX Index) to measure the market’s expectation of 30-day volatility implied by at-the-money S&P 100 Index option prices. Later, the original methodology was revised in 2003.
India VIX was introduced in 2008 and its methodology is an adoption of the method used by CBOE. Even the VIX is a trademark that is licensed to NSE by CBOE. So, India VIX is an index to measure the expectation of volatility of NIFTY over the next 30 days. Note that this is not the volatility of any other index or overall market.
Useful Resources on the Web
In my quest to find the methodology for calculating India VIX, I have spent many weeks but there is hardly any definitive reference available that is exhaustive in all respects. Hence I had to build or extrapolate some of the assumptions with the help of references which I am enlisting below.
1. White Paper by NSE on INDIA VIX.
This paper is the only available official resource on NSE that delves into VIX calculations and solved examples. However, there are some basic issues in this paper. This paper does not have any date of publication nor has any reference to external material. Hence data used in this paper can be tracked. Furthermore, The MIBOR rate which has been used as a reference does not have a source sighted.
Another big issue that I found was, that this paper spent so much space on explaining the methodology of fitting cubic spline to out-of-range option prices. This makes the calculation look very daunting and math-intensive. However, the sensitivity of the derived point on the VIX is very small, and average values can be used as an approximation. And for those who want to understand the mathematics of cubic spline, can visit this link.
2. CBOE VIX Methodology
This document gives details on CBOE VIX methodology. Interesting to note that there are 2 differences that the reader can spot immediately. CBOE uses a combination of weekly and monthly options [Bracket Method]. Details of which expiries to select are given in another white paper published by CBOE which specifies 23 to 37 days as the rolling window timeframe used for calculation. A second interesting fact is that even the time of expiration of weekly and monthly contracts is assumed differently. In the case of INDIA VIX, as per my understanding, only monthly contracts are used.
There is also mention of how to interpolate the risk-free interest rate.
Another useful piece of information available in the document is how to treat option prices for which the bid price is zero. My conclusion is that this only applies to bid prices and not ask prices.
3. Article by Mao Xin
This is another article that provides a worked example of VIX and a bit more insight into the derivation of the formula. Practically useful information is however to derive risk-free interest rates and how to select K0 i.e. strike price nearest to forward price. Even though the NSE paper suggests using the strike price below the future price, in my opinion, it’s not required.
4. Other useful resources.
I will mention only two other resources, though plenty of material is available on the web to go deeper into the understanding of VIX and its applications.
A paper by Osterrieder, Roschli, and Vetter explains the evolution of the VIX and comments on the interesting question of can market participants influence the VIX formula.
A paper by Li suggests some improvements in the VIX formula which can help eliminate the distortion of the VIX due to approximations and extremely out-of-money option prices. Interestingly calculated example also shows this problem as the option chain for 28th Mar 2024 shows quotes for the put option at 14000 levels when the strike price was hovering at 22000 levels.
Formula to Calculate India VIX
VIX is not a point estimate but rather the interpolated value between the two different point estimates on either side of the 30 days. So, to calculate the point estimate, two option chains are used. First is near month option chain and second is next month option chain. Whenever the days left to near month expiry are less than 3 days, the calculation rolls to the next and far month series. I presume this process of selecting the option expiries still holds even after the introduction of weekly options and no modifications are done as in the case of CBOE VIX. I did not find any documentation or resource that states otherwise.
The formula presented in the white paper by NSE to calculate the point estimate is given below.
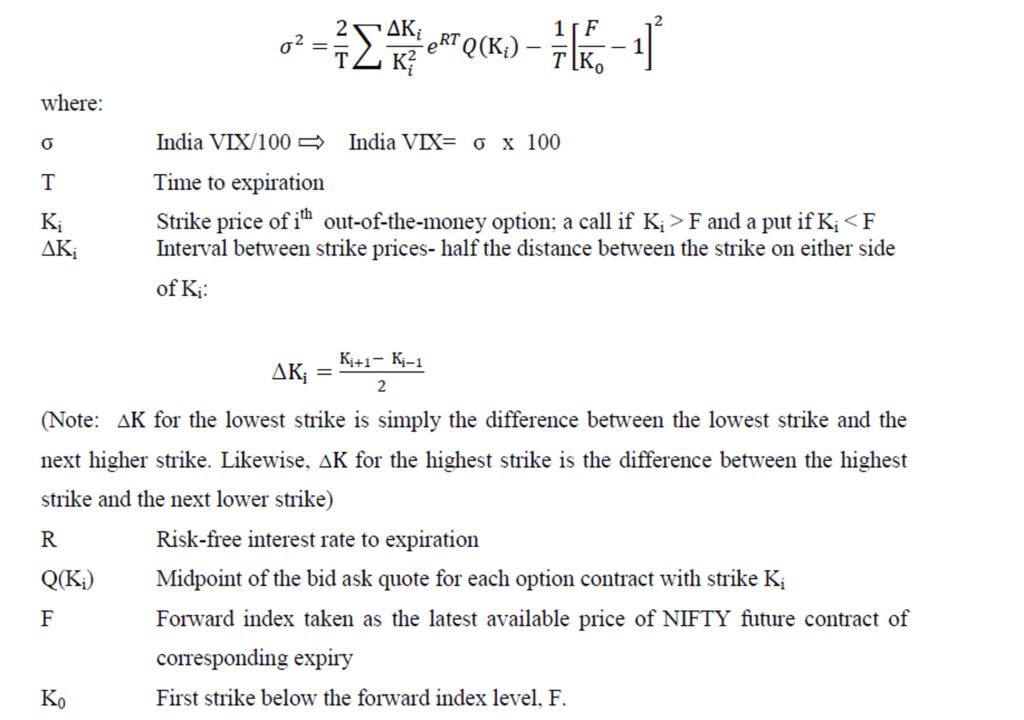
Let’s understand each of terms in bit more details.
Time to expiration (T)
This is the time taken in fraction of the year using minutes from the date and the time of calculation till the date and the time of expiry divided by the time in minutes for in the full year. I will walk you through more detail calculations in solved example.
The interesting part is ,2024 being leap year, there are 366 days rather than 365 in a year. Hence, I calculated the value using both sets of number just to find which value should be used to calculate minutes in a year. This is one more piece of details which I could not trace.
Risk-free Interest Rate (R)
NSE white paper mentions the reference rate at MIBOR, however, there are no references to the source from where we can get it. I found this website https://www.fbil.org.in/ which gives the reference rate though these rates are updated with a lag of almost a week and hence can’t be used for calculating VIX in real time.
I suggest a workaround to this conundrum. We do not use interest rate in calculation rather we use e^(rt) which is easy to derive since we know (T), which is time to expiry, and using future and spot prices we can calculate rather than R using the below equation.
Future Price = Spot Price * e^(rt)
In the solved example, I have used both sets of R values to compare the sensitivity of R on the value of VIX.
Determination of forward index level (F)
This is quite straightforward as NIFTY future prices are recommended to be used as values for F.
Computation of Mid-price Q(Ki) and selection of strike prices.
This computation is explained in a very detailed manner in the NSE paper. It essentially has the following steps.
a) Elimination of strike prices
This step is not explicitly mentioned in the NSE paper however CBOE article mentions it. All strike prices where there is no bid price can be excluded from calculations and if two consecutive strike prices have zero bid prices then the remaining strike prices are not considered. There is no mention of zero ask prices though hence in my calculations, I have eliminated the strike prices where zero ask prices were available but kept the remaining strike prices wherever both bid and ask prices are available.
b) calculate the mid-price and variance of mid-price.
This is a simple calculation as given by the formula below.
Mid-Price = (Ask Price + Bid Price) / 2
Variance = (Ask Price – Bid Price) / Mid Price
c) Cubic spline fitting
I fail to understand why on earth, this part is discussed in such a detailed way. This mathematical way of curve fitting is used to arrive at mid prices which are mispriced i.e. variance calculated for strike price is more than 30%.
Anyone, with a slight detest for complex mathematics, who starts reading the explanation given, will find this as very complex stuff. But you know what, one can simply ignore these strikes and prices from calculations and simply skip it and you may end with more or less similar values of VIX. [ pls try to verify this on your own].
But to prove that we can do better, I have used the cubic spline fitted values for calculations. One trick though, I used VBA and the custom formula given by this article.
( This is how smart people deal with complex things by taking the help of people who are smarter than them.)

There is also the process of selection of knot points which entails strikes above and below the misprice quote should have a variance below 30% and in case there are no knot points then the mispriced strike will be excluded from consideration.
Computation of K0
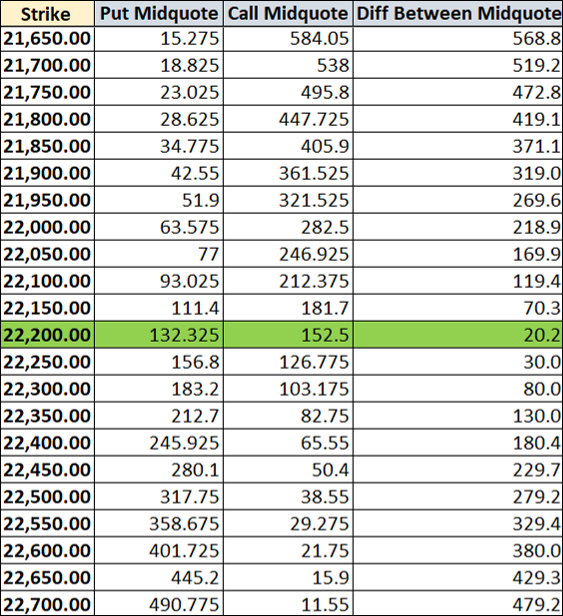
This bit is kind of dated as described in the NSE paper. It suggests assuming a strike price just below the future price to be considered an ATM strike price. Other references however suggest different methodology where the ATM strike price is taken as the price at which there is the smallest absolute difference between the mid-quote of the call and the put price.
I have used this method to calculate the ATM strike price in the solved example.
Interpolating INDIA VIX
Since we are repeating this process on 2 sets of expiries, we need to reach some sort of weighted average of values to get 30 days’ expectation of volatility.
The formula used for it is given below and as mentioned above it contains the number of days in year which can either be 365 or 366 for leap year, which I am unsure of.
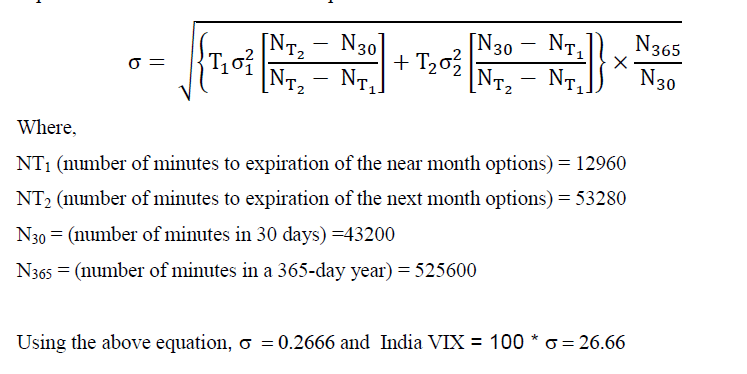
Solved Example for INDIA VIX
I have calculated VIX for two different days. The first example which I will explain in detail is for 23-Feb-2024 end of trading hrs i.e. 3:30 PM. And the second example is for 1-Mar-2024 at 12:00 PM. Getting the EOD data for the option chain is easier but to get option chain data for precise time during trading hours is difficult. Still, I managed to get data at around 11:59:41 AM which we can treat as a fairly good proxy for 12:00 clock data.
Values of VIX at both instances are given below.

Calculation for 23-Feb-2024, 3:30 PM.
We will choose option chains of 29-Feb-2024 and 28-Mar-2024 for estimating the VIX.
Time to expiration (T)
Excel helps here and rather than calculating the minutes to expire we use a simple formula of difference between date and time and multiply it by 1440 to convert the number in minutes.
Risk-free Interest rate (R)
Data for MIBOR is given below. If any reader has a better source of finding MIBOR do let me know in the comments. Excel sheet also calculates R based on future value and can be used for VIX calculations.
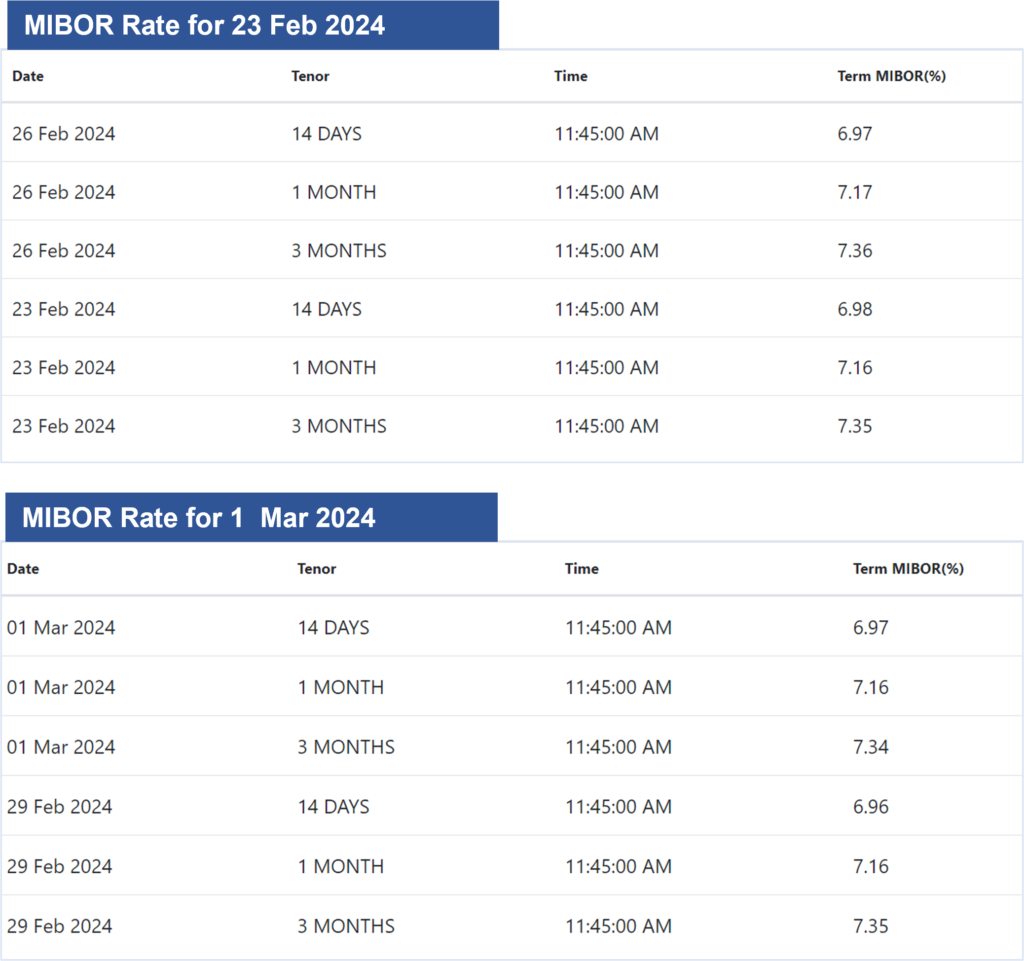
Calculation of Mid-quotes
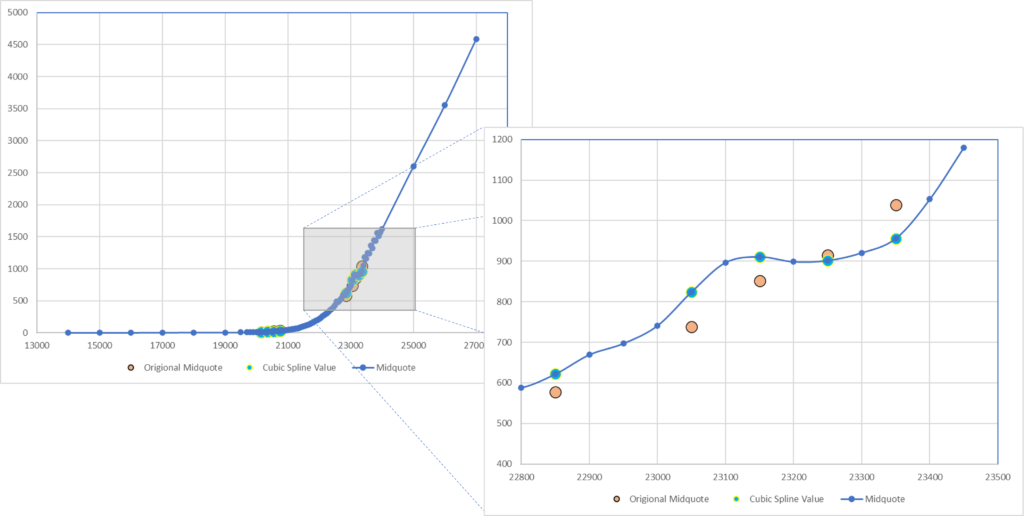
The next step is calculating Midquote and using the cubic spline method to correct the quotes. In the data set of 29-Feb-24 expiry, one can observe, that the put side of strike prices 18850, 18900 and 18950 do not have knot points and hence are excluded from consideration. Similarly, for data of 28-Mar-24 expiry, strike prices 19550, 19600, 19650, 19750, 19850, 19950, 20250 and 20450 do not have ask prices and hence are not used in calculations.
For the 28-Mar-24 expiry, derived values after eliminating some of the strike prices for mispriced put mid quotes are as below.
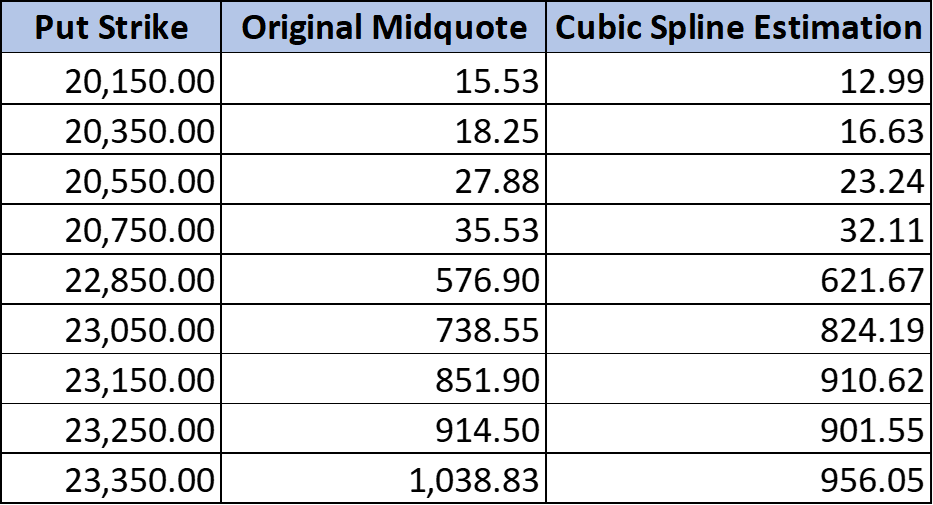
If we plot the graph of the put side of the option chain, we can see how the derived values smoothen the graph.
Estimation of the ATM strike price
For the estimation of the ATM strike price, I have used the method of finding lowest difference between call and put options. Sample calculations for 29-Feb-2024 are given below. Since the lowest difference is at 22,200, this will be considered as ATM level.
The remaining part of the calculations is pretty much straightforward since all the variables are calculated. I now present the comparative table of final calculations with actual value and % of the difference from the original value. For detailed calculations, refer to the Excel sheets attached in the last section of this article.

Calculation for 1-Mar-2024, 12:00 PM.
We will choose option chains that expire on 28-Mar-2024 and 15-Apr-2024 for estimating the India VIX.
Here, I will not repeat the process of explaining calculation steps and present the results directly.

Conclusion
As shown in the results, using the available data and method, we can calculate India VIX with almost 99% accuracy. One can further simplify the process by choosing to ignore some of the strike prices and the second term, 1/T *( K0/ F -1 )^2 which tends to be very small. I would urge readers to experiment with calculation to find many variants of quick estimates or any other modifications to achieve 100% accuracy of results. Through this post, I wanted to demonstrate that VIX calculations are not so complicated, and I hope these efforts will fuel some more curiosity in readers to experiment with VIX calculations.
I have attached detailed Excel sheets showing the India VIX calculations that can be downloaded, critiqued, and improved further.


