Table of Contents
Introduction
Mathematicians think markets are random in behaviour in general technical traders think otherwise. They generally consider markets to have 2 typical behaviors i.e. trending (either up or down) or trading (mean reverting). Traders try to identify the nature of markets since strategies that work in the trending phase of the markets do not work in the trading phase and vice versa.
When I was attempting to create my algorithmic trading system in 2016, I was experimenting with volatility-based approaches to distinguish phases of the market. Then I came across “Hurst Exponent”. It was a moment of epiphany since I loved the simplicity of this indicator (which I later found misleading). And I had attempted multiple times to integrate it with my system. However, I could not improve the performance of the trading system significantly. I attribute this fully to my failings and my impatience as I was desperate to create a working prototype of my trading system (which I may choose to discuss in my future blogs) as early as possible. Nevertheless, I intend to present a brief history of Hurst Exponent and its utility it to create regime-switching trading strategies and wise readers may experiment with it to improve their trading edge.
What is Hurst Exponent, Brief History

Hurst Exponent is derived from the works of Harold Edwin Hurst who was a British hydrologist and studied the pattern of water flow of river Nile.
Without dwelling too deeply on the mathematics of the study, it demonstrated that hydrological phenomena had some kind of non-random behaviour. This study was further explored for application in other fields.
Interesting readers can read this article which explains how his work was further used by other mathematicians.
Rather than writing an entire blog about Hurst Exponent, I would like to cite this source already available on the web which is well-referenced and written, to understand the concept clearly.
How to Calculate the Hurst Exponent in Excel and Python
This is where the fun begins… All the articles that you can refer to on the web will confuse you rather than help to provide a definite method to calculate the Hurst exponent.
A typical search will reveal that Hurst Exponent is not calculated but estimated. And there are many ways to estimate the same. Amongst all those references, clear choices are
- Rescaled Range Method – one that is used by Hurst himself
- Generalized Hurst exponent – introduced by Barabási and Vicsek (1991)
The rescaled range technique proposes to divide the sample into multiple ranges and the general thumb rule is range should have at least 8 observations. One of the popular blogs attempted to explain the calculation in detail however the observations are divided into very small range and I would recommend not using this approach.
Another variation that you may come across, is where Hurst Indicator for trading is created using only one range rather than dividing whole study sample into multiple ranges. I used this approach in my trading models. I suggest readers to avoid this approach as well.
We must understand that Hurst exponent is all about long-range memory and to use it precisely one must have a large set of observations. Even Mr. Hurst proposed his thesis only after spending over six rigorous decades observing data and studying the phenomena in detail.
If readers want to use Excel to calculate the Hurst exponent using the rescaled range method, there are very few readily available references. However, this video on YouTube explains the process of using Excel and the rescaled range method to estimate the Hurst Exponent meticulously.
As far as GHE is concerned, python code is available readily on the internet as discussed in detail in this thread.
We can also use Python packages Hurst and Nolds which give an out-of-box Hurst exponent function, however, what I could find out by going through the code was both implementations use a rescaled range algorithm. Hurst Module also specifies a limit of a minimum 100 observations for calculation.
Hurst Exponent and NIFTY
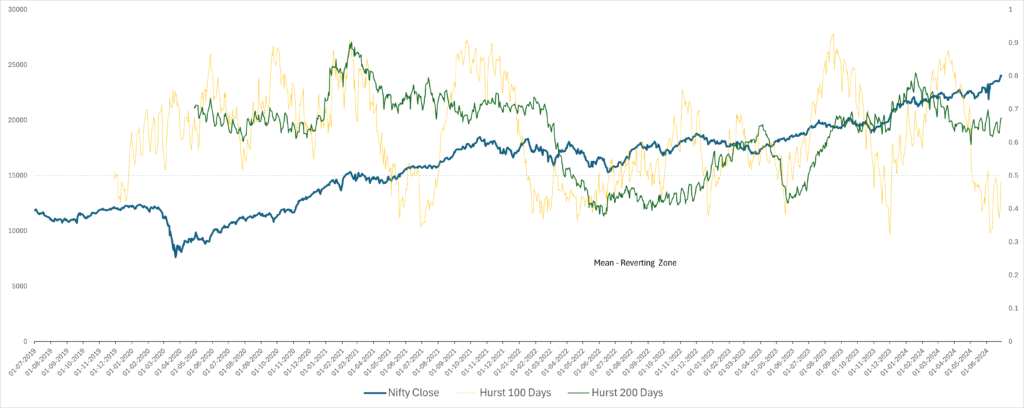
To analyze the nature of the Indian markets, I have analyzed data for the last 5 years daily returns [ July -19 to Jun 24 ]. Initially, I tried to plot the Hurst Exponent for 100 days using the Python package Hurst. However, the values were too noisy visually. [ I have not run any statistical test on it].
In the second iteration, I chose 200 days as the period for calculation. Results were smoother and showed a persistent long-term trend for Nifty. The combined graph of both simulations is given below for reference. You can see from the graph from Apr to Dec 2022, the value of the exponent dipped below 0.5 and NIFTY hovered in a range of approximately 500 points.

Conclusion
As I could gather utility of Hurst exponent for the trading market in the short term is limited since the entire study was about long-term memory. Also, I could not find any robust implementation or algorithm for short-term or day trading.
I see great potential in using the concept for long-term investing. As shown in a simple application of it on a daily time series of Nifty, one may look for persistence of trend and develop a system for entry or exit. Though this will require bit more investment of time and effort to establish a robust and statistically significant method.
(Please comment and update if you come across any work or study that is useful and available in the public domain.)


