
Table of Contents
Introduction
In this article, I will present to you a detailed understanding of what Nifty 50 is and more importantly how to calculate it step by step. I will also extend this methodology to another popular index, Bank Nifty.
You may have traded Nifty for most of your trading life but there is a high probability that trivial questions like how it’s calculated never would have occurred or some of you have attempted but not got enough clear answers. I will attempt to solve this mystery with a very simple approach which I must confess I discovered after an extensive online search.
What is Nifty 50?
Nifty is the premier indicator (let’s call it Index) of the stock markets of India, specifically the NSE. It has surpassed Sensex, an index of BSE in popularity and trading volume. So, what is an index? In simple terms, it’s just the average value of stocks. Obviously for Nifty, as its name suggests it will have 50 stocks chosen from 13 sectors of the economy.
There are multiple reasons why bourses create indices but the most important one is, that it is a simple indicator of market direction. Imagine Nifty as a wind direction indicator. With one look at it, you can gauge the direction of the market whether it’s up or down or flattish. No need for complex mathematics or information overload of knowing data of all stocks that are trading at that moment. It is a super quick way.
Standardized indices also serve as benchmarks to assess the portfolio performance. As an investor, you have infinite ways to invest your money and construct a portfolio by choosing various combinations of stocks or derivatives and the quantity or weight of stocks. Indices help you to measure the performance of the portfolio in a standardized way. Moreover, indices also allow one to create a portfolio that will track them without the need of complicated stock picking methods e.g. you can construct a portfolio of stocks that are part of Nifty and in exact proportions. This portfolio will almost match the returns of Nifty. (assuming you will rebalance this portfolio periodically as per Nifty).
History of Nifty
Nifty was created in November 1995 with a base value of 1000 and a market capitalization of ₹ 2.06 trillion (remember this value !!!) and as of Dec 2023, Nifty has surpassed 21000. You can read the interesting article available on the NSE website to know more about how Nifty has traversed this path. I will present a couple of facts that I found interesting.
# Fact 1
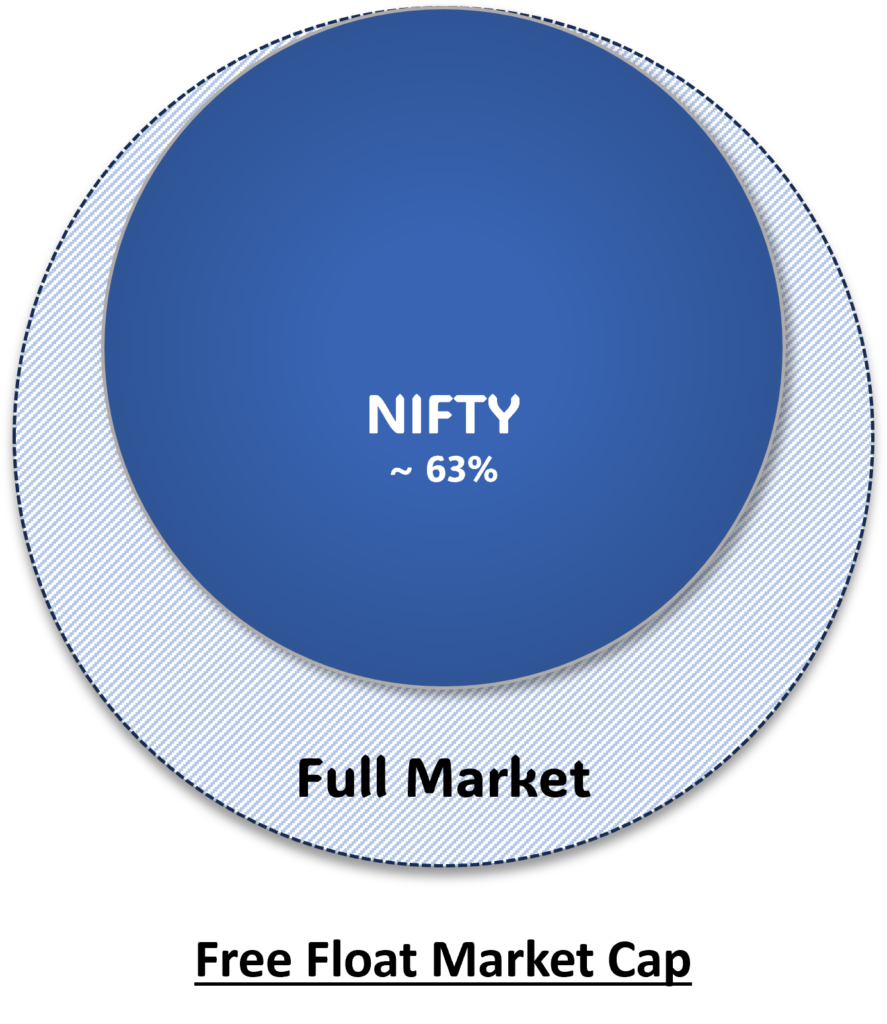
Nifty 50 collectively represents approximately 52% of the total full market capitalization and around 63% of the free float market capitalization of listed stocks on the NSE, based on a 6-month average as of June 30, 2023.
What this means is that NIFTY and its constituents dominate the trading volume.
# Fact 2
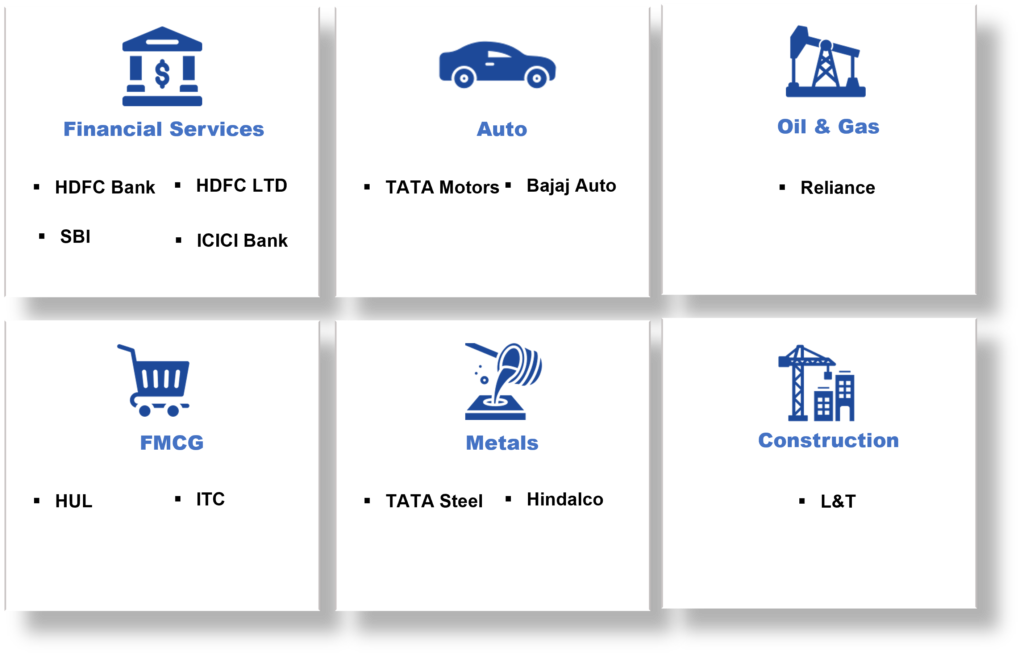
There are only 12 firms that have been part of NIFTY since its inception.
Interestingly this pack does not include any of IT companies like TCS and Infosys.
Method of Calculating Index
Before we delve into the NIFTY calculation methodology let’s briefly understand the popular methods by which the Index is calculated.
1. Market Capitalization Weighted
Overview: This is one of the most common methodologies, where the index components are weighted based on their market capitalization. The index value is more profoundly influenced by larger companies.
Calculation: Index value = Σ (Price of stock * Number of outstanding shares) / Divisor
Pros:
- Reflects Market Dynamics: This method aligns with the market’s valuation of companies, giving more weight to larger companies, which are often considered more significant in the economy.
- Ease of Implementation: Simple to implement, as it only requires market capitalization data.
Cons:
- Overemphasis on Large Caps: It can lead to overemphasizing the influence of a few large-cap stocks, potentially neglecting the performance of smaller companies.
- Vulnerability to Market Swings: The index is more sensitive to price movements in high-market-cap stocks.
S&P 500 (Standard & Poor’s 500) index is calculated using this methodology
2. Price Weighted
Overview: In this method, the index value is influenced by the absolute price of each stock, irrespective of market capitalization. Stocks with higher prices carry a greater influence on the index.
Calculation: Index value = Σ (Price of each stock) / Divisor
Pros:
- Simple Calculation: The calculation is straightforward, as it involves adding up the prices of individual stocks.
- Reflects Absolute Price Movements: This gives more weight to stocks with higher absolute prices, which may be suitable for certain investment strategies.
Cons:
- Distorted Representation: Ignores the market capitalization, potentially leading to a distorted representation of the overall market.
- Impact of Stock Splits: Stock splits can significantly impact the index value.
Dow Jones Industrial Average (DJIA), one of the oldest and most popular indices, uses this methodology for its calculations.
3. Equal Weighted
Overview: All index components are given equal weight, regardless of their market capitalization or stock price.
Calculation: Index value = Σ (Price of each stock) / Number of stocks
Pros:
- Diversification: Provides a more diversified market representation by giving equal weight to all stocks.
- Small-Cap Emphasis: Highlights the performance of smaller companies, which may be overlooked in market capitalization-weighted indices.
Cons:
- Lack of Consideration for Size: Ignores the size or significance of companies, potentially giving too much weight to smaller, less impactful stocks.
- Higher Turnover: Rebalancing may result in higher turnover and transaction costs.
Methods like Fundamental Weightage are also used to create indices for specific purposes.
NIFTY 50 Calculation Methodology
The computation of the Nifty 50 using the free float methodology commenced on June 26, 2009. There is an article on the NSE website that mentions the below formula on page 203 for NIFTY calculations.
Index Value = Index Market Capitalization / Base Free Float Market Capitalization of index * Base
Where,
Index Market Capitalization = Shares outstanding * Price * IWF * Capping factor
The same article, on page 191, explains what IWF means. It is the percentage of the total stock that is available for the public to invest or trade in. There are details of which categories are classified as public and which are not. Readers who are interested in the same can go through the article.
However, neither that article nor any of the websites shown on Google’s top search results (till this blog is published) gives data for IWF for each stock. It’s not available easily on the Internet.
So, I attempted the approach of calculating the free float market cap of all stocks in Nifty. You can easily find the market cap and free float market cap on the NSE website. Free float percentage can also be approximated using annual reports, but this method is tedious.
Sample data for Reliance and ICICI is given below as a reference.
Reliance Data

ICICI Data

Data for Market Cap as of December 31st, 2023, for all 50 stocks is tabulated below
| Company Name | Market Capital | Free Float | Percentage of Free Float |
|---|---|---|---|
| Adani Enterprises Ltd. | 32,479,201.94 | 7,470,216.45 | 23% |
| Adani Ports and Special Economic Zone Ltd. | 22,098,221.41 | 7,513,395.28 | 34% |
| Apollo Hospitals Enterprise Ltd. | 8,207,228.22 | 5,745,059.76 | 70% |
| Asian Paints Ltd. | 32,562,366.98 | 15,304,312.48 | 47% |
| Axis Bank Ltd. | 33,927,293.65 | 30,534,564.28 | 90% |
| Bajaj Auto Ltd. | 19,312,859.36 | 7,725,143.74 | 40% |
| Bajaj Finance Ltd. | 45,208,388.08 | 20,343,774.64 | 45% |
| Bajaj Finserv Ltd. | 26,931,851.16 | 9,156,829.40 | 34% |
| Bharat Petroleum Corporation Ltd. | 9,783,329.88 | 4,304,665.15 | 44% |
| Bharti Airtel Ltd. | 57,904,333.34 | 26,056,950.00 | 45% |
| Britannia Industries Ltd. | 12,864,293.95 | 6,303,504.04 | 49% |
| Cipla Ltd. | 10,091,879.98 | 6,559,721.98 | 65% |
| Coal India Ltd. | 23,184,183.97 | 8,578,148.07 | 37% |
| Divi’s Laboratories Ltd. | 10,375,043.04 | 4,980,020.66 | 48% |
| Dr. Reddy’s Laboratories Ltd. | 9,681,617.40 | 7,067,580.70 | 73% |
| Eicher Motors Ltd. | 11,312,403.66 | 5,656,201.83 | 50% |
| Grasim Industries Ltd. | 14,041,091.24 | 7,863,011.10 | 56% |
| HCL Technologies Ltd. | 39,836,603.61 | 15,536,275.41 | 39% |
| HDFC Bank Ltd. | 129,721,283.17 | 128,424,070.33 | 99% |
| HDFC Life Insurance Company Ltd. | 13,897,562.44 | 6,809,805.59 | 49% |
| Hero MotoCorp Ltd. | 8,287,321.36 | 5,386,758.89 | 65% |
| Hindalco Industries Ltd. | 13,803,527.49 | 8,972,292.87 | 65% |
| Hindustan Unilever Ltd. | 62,492,078.80 | 23,746,989.94 | 38% |
| ICICI Bank Ltd. | 70,033,330.55 | 70,033,330.55 | 100% |
| ITC Ltd. | 57,637,312.06 | 40,922,491.57 | 71% |
| IndusInd Bank Ltd. | 12,411,827.89 | 10,550,053.71 | 85% |
| Infosys Ltd. | 64,026,879.19 | 55,063,116.10 | 86% |
| JSW Steel Ltd. | 21,471,085.82 | 8,373,723.47 | 39% |
| Kotak Mahindra Bank Ltd. | 37,842,604.35 | 28,003,527.22 | 74% |
| LTIMindtree Ltd. | 18,585,032.75 | 5,761,360.15 | 31% |
| Larsen & Toubro Ltd. | 48,384,100.69 | 41,610,326.59 | 86% |
| Mahindra & Mahindra Ltd. | 21,450,872.33 | 15,444,628.08 | 72% |
| Maruti Suzuki India Ltd. | 32,389,281.57 | 13,603,498.26 | 42% |
| NTPC Ltd. | 30,108,148.35 | 14,752,992.69 | 49% |
| Nestle India Ltd. | 25,688,039.21 | 9,504,574.51 | 37% |
| Oil & Natural Gas Corporation Ltd. | 25,852,473.77 | 8,014,266.87 | 31% |
| Power Grid Corporation of India Ltd. | 22,009,878.94 | 10,784,840.68 | 49% |
| Reliance Industries Ltd. | 175,028,273.67 | 87,514,136.83 | 50% |
| SBI Life Insurance Company Ltd. | 14,338,760.95 | 6,452,442.43 | 45% |
| State Bank of India | 57,269,234.78 | 24,625,770.96 | 43% |
| Sun Pharmaceutical Industries Ltd. | 30,232,820.29 | 13,604,769.13 | 45% |
| Tata Consultancy Services Ltd. | 137,487,325.68 | 38,496,451.19 | 28% |
| Tata Consumer Products Ltd. | 10,116,936.87 | 6,576,008.96 | 65% |
| Tata Motors Ltd. | 25,898,270.41 | 13,726,083.32 | 53% |
| Tata Steel Ltd. | 17,130,184.78 | 11,305,921.96 | 66% |
| Tech Mahindra Ltd. | 12,424,620.45 | 7,951,757.08 | 64% |
| Titan Company Ltd. | 32,722,910.07 | 15,379,767.73 | 47% |
| UPL Ltd. | 4,411,321.11 | 2,955,585.14 | 67% |
| UltraTech Cement Ltd. | 30,261,147.57 | 12,104,459.03 | 40% |
| Wipro Ltd. | 24,595,701.36 | 6,640,839.37 | 27% |
| Total | 1,707,812,339.59 | 949,796,016.17 | 56% |
The total free float market cap as per this table is 94,97,96,016.17 (₹ Lakhs). Let’s try to calculate the index with this value by dividing it by 2.06 trillion (the number that I told you to remember) and multiplying by 1000 for base adjustment.
(94,97,96,016.17 * 1,00,000/ 2.06 *1,000,000,000,0000 ) *1000 = 46106.60

But this is not the current Nifty value. So you may be wondering where did we go wrong.
Let’s try to calculate what should have been the actual divisor based on the current value of NIFTY
Divisor = 94,97,96,016.17 * 1,00,000 / 21,731.40 (NIFTY Closing value as on 31st Dec 2023)
Divisor = 43,70,615,865
This is a mysterious number. There is hardly any direct reference available on the Internet. So next section will show a way to find this number as well as data for IWFs.
True Method for NIFTY 50 Calculation
How to find IWFs of NIFTY 50
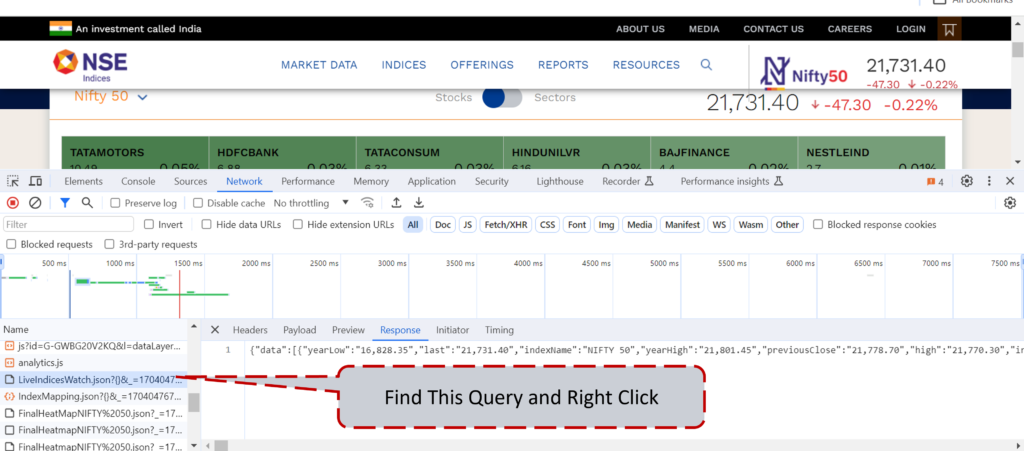
Courtesy of this YouTube video, I found the method which helps to find IWFs and divisor which we calculated earlier. It involves fetching data from API calls exposed on the website.
Step 1: visit the link https://www.niftyindices.com/market-data/index-movers.
Step 2: Go to Developers Tools of your browser (Ctrl + Shift + I for Chrome) and search for the Network tab.
Step 3: Find the query as shown in the below screenshot and right-click on it to copy the link address.
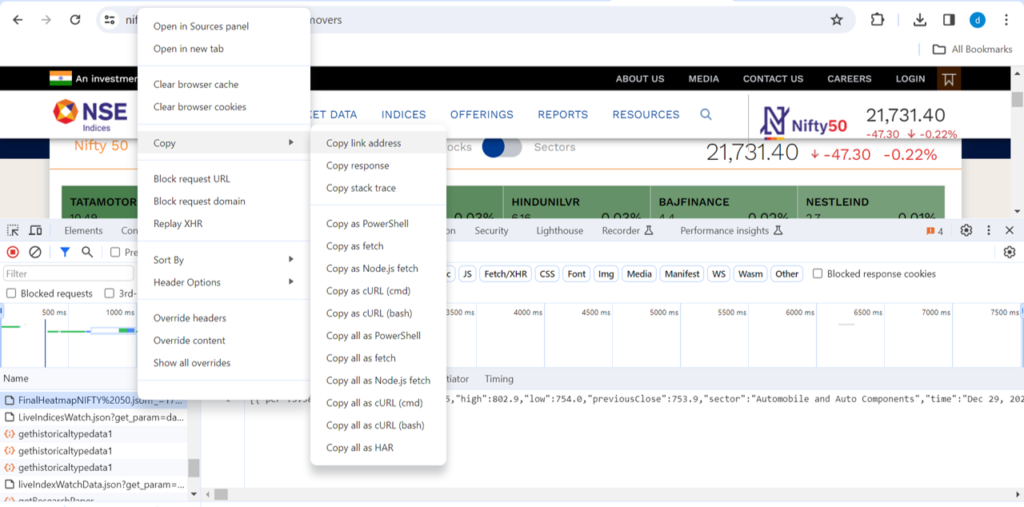
Step 4: go to “https://data.page/json/csv” and paste the link as shown in the picture below.
You may also use any of the other JSON converters or power query to transform data that can be used in Excel.
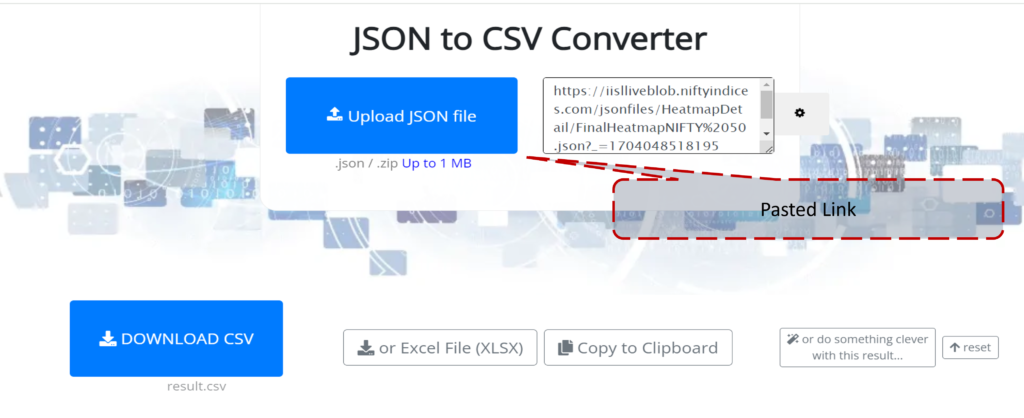
Step 5: Import converted data in Excel. The illusive divisor value, as shown in the image, is available in the data.
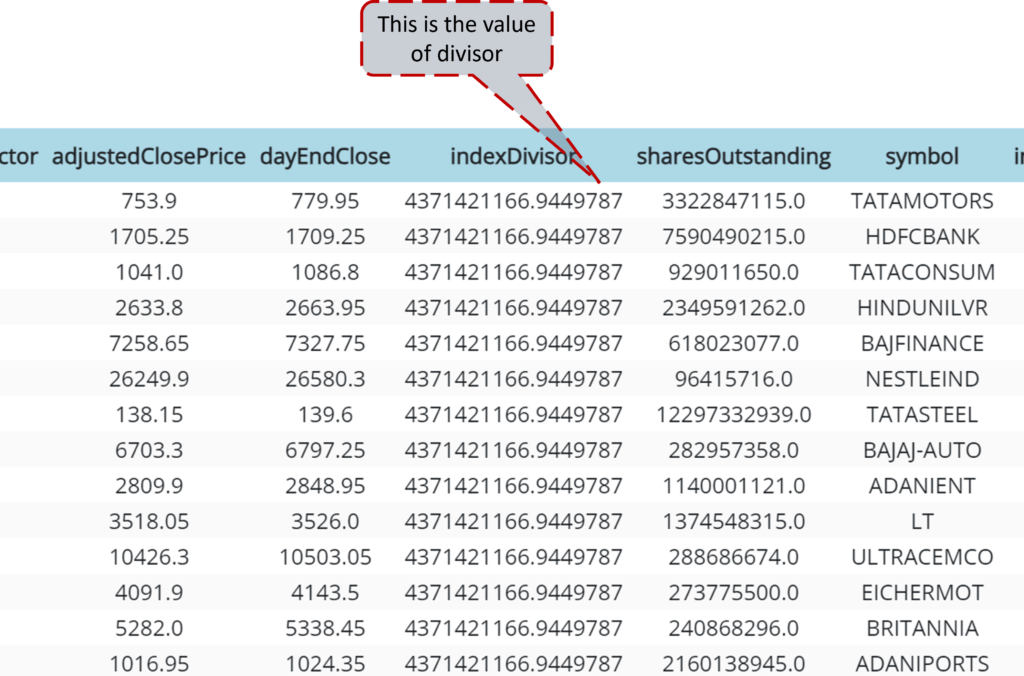
Now with this data, let’s attempt to calculate the index…
The formula for calculating Index
Free float market capitalization = Sum(Last traded price * Shares outstanding * IWF * Capping Factor)
Index = Free float market capitalization /Divisor
Using a divisor value of 43,71,42,1167 as per data, the calculated NIFTY 50 value is 21727.40 which is slightly different due to closing adjustments and rounding off errors.
To cut the efforts of recreating the data fetching mechanism, I have created an Excel sheet that has all the queries to fetch data using power query. This Excel sheet has calculations for NIFTY 50 as well as for other popular indices like BANKNIFTY, NIFTY MIDCAP, and FINNIFTY along with a heatmap for Index constituents (a small bit of VBA coding is implemented to get the color coding).
You can download this Excel for free from here.
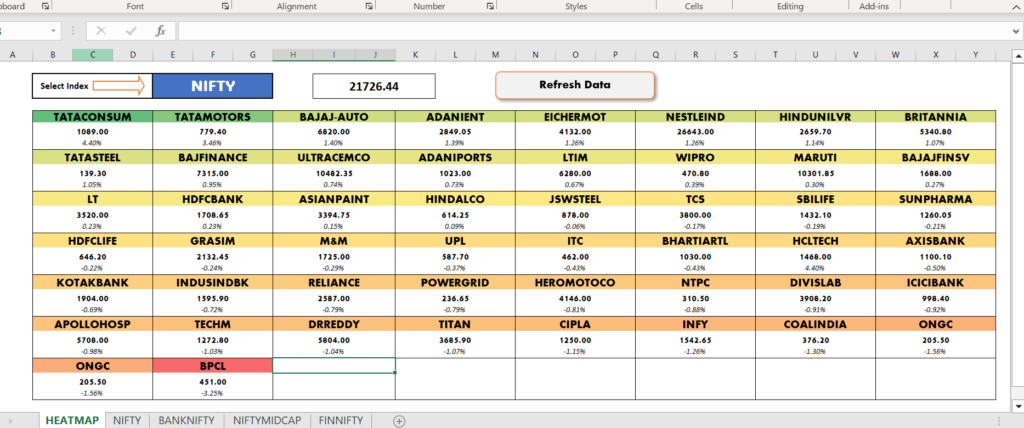
This precious data source not only helps to get IWFs and Capping factors but also helps to understand which stock and sector influences NIFTY or other indices most. I will leave this bit for readers to calculate.
I trust this article has demystified the intricacies of calculating the NIFTY 50. Your feedback and comments are appreciated.


It’s very valuable information.